Category Archives: Uncategorized

Why Are There Negative Nutrient Values in My Output Files?

There are a few possible reasons you may see negative nutrient values in your output files.


Database maintenance

The way NCC maintains our database can, in very limited cases, lead to negative nutrient values in the output files when records are restored from an older version of NDSR into a newer version of NDSR.  For the most part this is very rare, though we are aware of some instances where foods entered into prior versions of NDSR that are restored into NDSR 2025 or subsequent versions may result in negative non-heme iron values.  If you notice negative nutrient values in output file 02 (food file) that are not due to any of the reasons below, please contact us at NDSRhelp@umn.edu and we can provide you with information so you can correct the negative nutrient values in your data set.


Food Formulations

When creating formulations for multi-ingredient foods in the database, we may subtract components such as water, sodium, or potassium.  Therefore, when you look in output file 01 (component/ingredient file), you may see negative nutrient values for those components of a database food.  For example, when making a fast food hamburger we may subtract sodium to match the nutrient value provided by the restaurant.  The nutrient totals for the food will be correct (not negative) in output file 02 (food file).  The negative nutrient values in output file 01 are intentional and do not need to be addressed.   


User Recipes

If you create a User Recipe that includes a negative amount, you will see that negative amount, and therefore negative nutrients, in output file 01 (component/ingredient file).  If the negative amount was intentional and is not causing negative nutrient values in output file 02 (food file), then this does not need to be addressed.  If you are finding negative nutrient values in output file 02 for a User Recipe that you created, then you should correct the User Recipe, and reselect the corrected User Recipe into the record.  If you are finding negative nutrient values in output file 02 for a User Recipe that NCC sent you for a new food request, please contact us at newfoods@umn.edu.


View/Paste Ingredients Feature

Another action that can result in negative nutrient values in output file 01 (component ingredient file) and output file 02 (food file) is using the View Ingredients feature to paste the ingredients of a mixed dish into an assembled food. If the pasted formulation includes a negative amount (that would typically only be seen in output file 01), it will now be present in both output file 01 and output file 02 because it is part of the assembled food. You will have to determine on a case-by-case basis if the negative value in the assembled food is correct, depending on the changes you made to the ingredients.  You may consider summing the nutrient totals for the components of the food to ensure that the net nutrient totals are not negative. 


Entering negative amounts in a record

If you enter a negative amount in a record, then you will see negative nutrient values in output file 02 (food file) and output file 01 (component/ingredient file).  If the negative amount was entered into the record in error, then correct the negative amount in the record. 


If the negative amount was entered intentionally, then you may not need to address it.  For example, if your study is looking at daily nutrient totals (not conducting analysis at the food level), and you used a negative amount to subtract lettuce from an NDSR sandwich that includes lettuce, then your daily totals would be correct, and you would not need to make any changes.  If you are intending to conduct analysis at the food level, then you may want to avoid entering negative amounts in the record.


NCC News Bite – October 2024

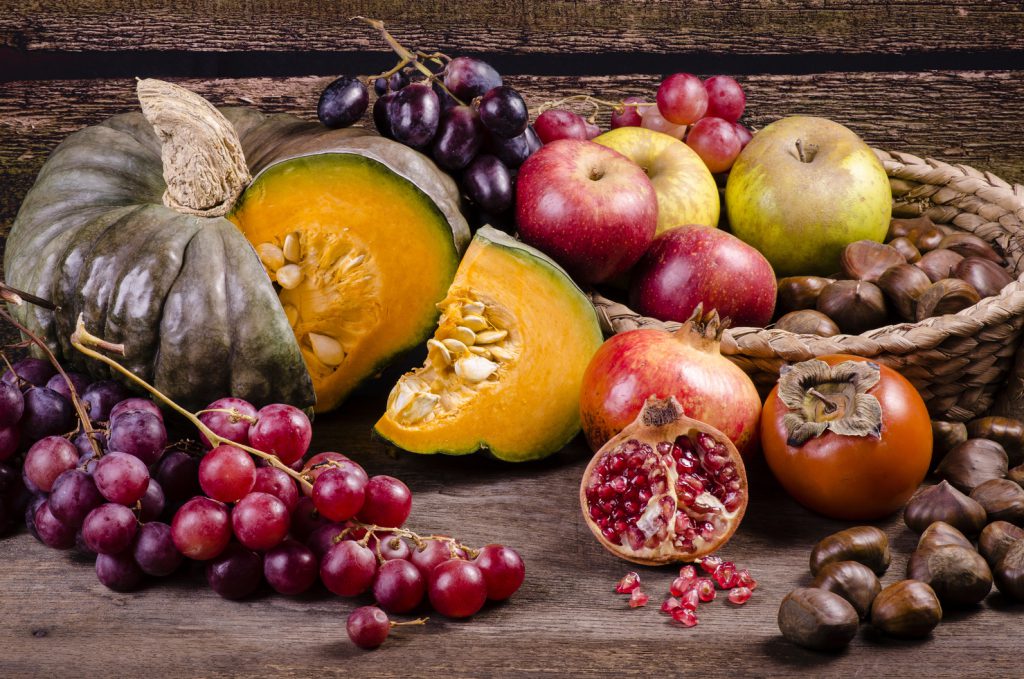
seasonal foods

This edition contains the following articles:


NDSR 2025 Sneak Peak: Heme and Non-Heme Iron


With NDSR 2024 released in July, we are now hard at work preparing the 2025 version of NDSR. One major area of work is adding heme iron and non-heme iron to NDSR 2025 and the 2025 NCC Food and Nutrient Database files. In recognition of the importance of being able to quantify intake of these forms of iron, the National Cattlemen’s Beef Association provided funding to support this work. If you are interested in looking at heme and non-heme iron in your data entered into previous versions of NDSR, you will be able to restore backup files of your data into NDSR 2025 and then generate output files which will include these two new nutrients. (Just one more reason why your backup files are gold!)


Let us know about the nutrients or other food components you’d like added to NDSR (ndsrhelp@umn.edu), and consider a research partnership to support the addition of a specific nutrient or food component. The effort (and in turn cost) involved in adding novel nutrients and food components poses a challenge to their timely addition to NDSR, but this challenge may be addressed through research partnerships. One example of a successful partnership is the addition of lignans to NDSR 2019 in response to the needs of a study being conducted by researchers at Harvard University. Gluten was added to NDSR in 2017 through a similar type of partnership with a researcher at Columbia University. If you are interested in partnering to support the addition of a nutrient or food component to NDSR, please contact us.


NCBA logo


Did You Know? NDSR has the NCC Food Group Serving Count System AND MyPlate Food Groups


NDSR has long included the NCC Food Group Serving Count System, which is a flexible system for calculating food group intakes. In this system there are 174 subgroups (e.g. sweetened soft drinks, citrus fruit, wine, etc.) that nest within nine main food groups. Values for each subgroup are available at the food, meal, and day levels in output files 07-09.


What you may not know is that NDSR has MyPlate food groups as well for recall, record, record-assisted recall, and menu record types. When we added the Healthy Eating Index (HEI) to NDSR 2022, we created output files that include not only HEI total and component scores, but also variables which make up the contributing dietary constituents used for calculating the HEI component and total scores, which includes the following MyPlate food groups: dairy (cup equivalents), total fruit (cup equivalents), whole fruit (cup equivalents), total vegetable (cup equivalents), greens and beans (cup equivalents), total protein (ounce equivalents), seafood and plant protein (ounce equivalents), whole grains (ounce equivalents), and refined grains (ounce equivalents). Values for each of these MyPlate food groups are provided at the meal and daily total levels in output files 22 and 23.


Wondering which food grouping system you should use? The answer to this question depends on the food categories of interest to you. For example, if you want to examine intake of sweet baked goods, sugar sweetened beverages, or alcoholic beverages, you’ll want to use the NCC Food Group Serving Count System output files. However, if you want to examine intake of a food group in MyPlate (e.g. servings of dairy, whole grains, refined grains, etc.) you’ll want to use the variables available in the NDSR HEI output files.  


Chapter 8 of the NDSR User Manual provides specifications for each of the output files for your reference. Our webpages that provide an orientation to the NDSR output files may also be helpful to you.


My Plate


Looking Back at NCC’s History


This year we celebrate NCC’s 50th Anniversary! With the help of current and former NCC employees, we’ve been working to document our rich history, with a summary available on our ‘About NCC’ page, and an in-depth version also available. 


For a brief overview of our history, read on.


NCC was started by NIH in 1974 to support the MRFIT study and the Lipid Research Clinics. For these studies, a mainframe computer-based food coding and nutrient analysis system was created by NCC with the help from other experts, for in-house use. From there, a microcomputer system for 24-hour dietary recall collection was developed. Then in 1989, an MSDOS based software program was developed for distribution to researchers for use on their personal computers. In the mid-1990’s NCC embarked on developing a Microsoft Windows-based version of the program, which would eventually be called NDSR. Over this time, NCC’s food and nutrient database grew in number of foods and number of nutrients. NDSR is now considered a gold standard for dietary intake assessment, and the NCC Food and Nutrient Database has more foods (around 19,500) and nutrients (178 nutrients, nutrient ratios and other food components) than any other research quality food and nutrient database.


We are extremely proud to be fulfilling our mission to support nutrition research and health promotion by providing state-of-the-art software and databases for nutrition assessment. And, we are thankful to each of you for the support you provide through use of our products and services, and the input you provide on ways we can improve NDSR and our database. Full steam ahead together for another 50 years!


Pictured below: NCC Staff, NDSR 2024 Release Party


NCC staff pic


NDSR Training


The next NDSR Training Workshops are scheduled for November 18-19, 2024 and January 13-14, 2025. Trainings are held via Zoom from 9am-5pm CT both days. Register here by November 6th if you are interested in the November training or by January 1st if you are interested in the January training. Space in the training workshops is limited and registration may close early if all seats fill before the cutoff date.

Online training


New Foods


The following new foods are available with this edition of the NCC News Bite. A New Foods Backup File is available for download on our website under New Food Backup Files, “October 2024”.

    • Celsius Sparkling Beverage
    • Egglife Egg White Wraps
    • Ensure Plus High Protein Drink – Vanilla
    • McDonald’s McGriddle – Chicken
    • Nature Valley Crispy Creamy Wafer Bar – Strawberry
    • Oatly Cream Cheese – Plain
    • Pocky Sticks Cookies
    • Prime Hydration Drink – Lemonade

Ensure bottle

Can you use NDSR data to assess intake of ultra-processed foods?

NDSR does not classify foods into the four NOVA categories. However, a researcher may carry out this classification for foods entered into NDSR dietary recall, record, and menu record types. There are multiple ways this may be done. Sneed et al. report on one approach using their NDSR data (1). These authors assess inter-rater reliability and note that their data files are available to researchers on request. Below we describe another potential approach.
 
Potential approach for classifying foods in NDSR dietary recall, record and menu record types into the four NOVA categories.
 
1) For your set of dietary recalls/records/menus identify all unique food IDs in output file 02 (file that lists foods at the whole food level).
 
2) Sort the list of unique food IDs by the NCC Database Food Group ID* to facilitate coding.
 
3) Review the unique food IDs in your dataset, and then develop coding rules that will allow for classifying each food ID into one of the four NOVA categories.
 
Some of the coding rules you develop may leverage the NCC Database Food Group ID. For example, you may decide to specify in your coding rules that all foods with an NCC Database Food Group ID of 63 (‘Fruits, fresh and unsweetened’) be coded into the NOVA class 1 (‘Unprocessed or minimally processed’) category.
 
For some types of restaurant and packaged foods you may decide to develop coding rules that require going to the food company website to locate the food’s ingredient statement so that a classification determination may be made. Note that ingredient information is generally not available in output file 01 (component ingredient file) for packaged foods. Ingredient information is generally available for restaurant foods, but it should not be relied on for determining classification because NCC formulations for both packaged and restaurant foods include only those food ingredients that contribute to the nutrient content of the food. As a result, ingredients included in small amounts that do not contribute to nutrient content, such as most food flavorings, colorings, emulsifiers, and preservatives, are generally not included in the formulation.
 
For some types of restaurant and packaged foods you may develop general rules that do not require locating the product ingredient statement. For example, you may establish a rule that all soft drinks be coded into NOVA class 4 because these products are generally formulated in a way that involves including one or more ingredients that conform with class 4 criteria.
 
For multi-ingredient home prepared foods (e.g. home-made lasagna, pizza, cookies, etc.) the ingredients used in preparing the food are available in output file 01 (component ingredient file), and may be used to guide food coding decisions for these types of foods.
 
4) After NOVA classification codes have been assigned to all unique food IDs in file 02, statistical analysis code may be written to assign NOVA classification codes to all foods in all records in file 02. Then, code may be written to create processed food variables of interest for your study (e.g. times per day ultra-processed foods were consumed; percent of total calories from ultra-processed foods, etc.).
 
* The NCC Database Food Group ID’s, categories, and names are provided in the NDSR file ‘Nccdbfg[insert version].txt in the ‘Database Documentation Files’ folder within the ‘Additional Files’ folder. For Windows installations, the Additional Files are located at C:\Users\Public\Documents\NCC\NDSR [insert version]\Additional Files\Database Documentation.
 
1. Sneed NM, Ukwuani S, Sommer E, Samuels L, Truesdale K, Matheson D, Noerper T, Barkin S, Heerman W. Reliability and Validity of Assigning Ultra-Processed Food Categories to 24-Hour Dietary Recall Data Collected Using the Nutrition Data System for Research (NDS-R). Current Developments in Nutrition 2022;6:778.

There are two added sugar variables in the NDSR output files- Added Sugars (by Available Carbohydrate) and Added Sugars (by Total Sugars). What is the difference between the two?

Added Sugars are those sugars and syrups added to foods during food preparation or commercial food processing. Ingredients designated as “added sugar” foods in the NCC database include: white sugar (sucrose), brown sugar, powdered sugar, honey, molasses, pancake syrup, corn syrups, high fructose corn syrups, invert sugar, invert syrup, malt extract, malt syrup, fructose, glucose (dextrose), galactose, and lactose. They do not include mono- and disaccharides occurring naturally in foods, such as lactose in milk or fructose in fruit.
 
The Added Sugars (by Available Carbohydrate) value assigned by NCC to foods considered to be sources of added sugars represents the amount of available carbohydrate present in the food, which includes saccharides of all types. Mono- and disaccharides along with saccharides with a higher degree of polymerization that are resistant to digestion (e.g., trehalose) are included under this definition.

For example, corn syrups with different Dextrose Equivalency (DE) contain a high amount of trisaccharides and other higher saccharides (approximately 75%) due to the incomplete hydrolysis of the cornstarch. These more complex sugars are included under Added Sugars (by available carbohydrate).
 
The Added Sugars (Total Sugars) value assigned by NCC to foods considered to be a sources of added sugars represents the amount of total sugars present in the food, which includes only mono- and disaccharides.

The nutrient values for brand name food products in the database don’t precisely match the values on the product’s Nutrition Facts panel. Why?

Nutrient values in the NCC Food and Nutrient Database for brand name foods do not precisely match the information on product Nutrition Facts panels for a number of reasons. One reason is that values in the database are not rounded to the nearest whole number as is allowed on the Nutrition Facts panel. Another reason is the database values may not reflect recent changes in the marketplace. For example, if General Mills reformulates Cheerios® today, the nutrient values in the current database may no longer match those on the product label. Discrepancies between database and Nutrition Facts panel values may be due to use of the nutrient composition of representative foods for some brand name product categories for which the nutrient composition across brands is similar.
As an example, although the database includes several brands of pretzel twists, the nutrient values assigned to each are based on a representative pretzel twist. It is important to note that use of a representative food is only done when variation in nutrient content across brands of a product is minimal.

The database includes several brand name products in some food product categories such as snack crackers but no brand name products in other categories such as canned and frozen vegetables. Why?

Brand name products are included if there are significant differences in the nutrient composition of food products within a category. For example, different brands of potato chips are included in the database because the fatty acid content of chips varies notably across brands. Another reason for including brands relates to how people tend to describe the food. For example, commercial cookies tend to be described by brand name (e.g., Oreo® cookie) rather than by generic food description (e.g., chocolate sandwich cookie).

How does NCC decide whether to add new nutrients or food components to the database?

The following factors are considered in deciding whether to add a nutrient or other food component to the database:

  • Scientific Interest: Is there demand for it? If there is a nutrient or food component you’d like added to the database please let us know(ndsrhelp@umn.edu).
  • Availability of Food Composition Information: Is there analytic composition information available for a significant proportion of core foods in the NCC Food and Nutrient Database?
  • Quality of Analytic Data: Is the analytic information available of sufficient quality (e.g., obtained using appropriate analytic methods) for use in assigning values to foods in the NCC Food and Nutrient Database?

How does NCC assign nutrient values to unknown foods, and how can I figure out what food is being used as the ‘default’ for unknown foods?

In the NCC Food and Nutrient Database there are foods defined as ‘unknown’ (e.g., ‘milk, unknown % fat’). These foods may be selected when a participant does not know the level of detail required for a food.


To assign nutrient values to unknowns NCC uses the nutrient values for the form of the food that is believed to be most commonly consumed in the U.S. For example, the nutrient values for 2% milk are utilized for ‘milk, unknown % fat’. To decide what is most common, NCC relies on scientific and food industry publications that report dietary intake patterns and product sales. Professional judgment is also used where published data is lacking.


If you need to know what food an unknown food defaults to you can look in the output files. The Food File (output file 02) lists the food as it was selected (e.g., milk, unknown % fat). The Component/Ingredient File (output file 01) lists the default food that is associated with the unknown food (e.g., milk, 2 % fat). To quickly identify unknown foods in your dataset use the column in file 2 labeled ‘Unknown (default) Food’. If a food is an unknown there will be a ‘1’ in this column.

Can NDSR be used to estimate intake of FODMAPs (fermentable oligo-, di-, and monosaccharides and polyols)?

NDSR output files include intake estimates for monosaccharides (fructose, galactose, glucose, tagatose), disaccharides (lactose, maltose, sucrose) and a variety of polyols (erythritol, inositol, isomalt, lactitol, maltitol, mannitol, pinitol, sorbitol, xylitol). Intake estimates for oligosaccharides are not available. Thus, intake of all types of FODMAPs except oligosaccharides may be estimated using data available in the output files.

How do I open my output in Microsoft Excel and view it?

If you plan to analyze your data using Excel, you may want to generate the output files with the headers. Once you have generated the output, you will first need to extract the output files. Then open Excel, select Open from the File menu, and browse to the location of the output file you wish to open. Change the “All Excel Files” option to “All Files” in the drop down menu above the Open button, then select the file you want to open. A Text Import Wizard in Excel will pop up and should already recognize that the .txt files are tab delimited. Select “finish” to open the file.