
This edition contains the following articles:
- NCC Forum Highlights
- Did you know? Featuring: NDSR View and Paste Ingredients Function
- NCC Associate Director Dr. Abby Johnson at Nutrition 2024
- NCC Presentations from the National Nutrient Databank Conference
NCC Forum Highlights
Last month, NCC launched a Nutrition Coordinating Center Forum on LinkedIn Groups to provide a place for NDSR Users and NCC Food and Nutrient Database clients/users to ask each other questions and share resources. This is meant to facilitate user-to-user interaction. Technical help and licensing should continue to be sent to NDSRhelp@umn.edu.
In case you missed it, other NDSR users would love your input on these topics:
- What are other researchers offering as financial incentives to participants for completing 24-hr dietary recalls?
- How do you decide whether to build assembled foods or pick a database food for foods reported by individual participants?
- When we send food homogenates of a full day’s menu to analytical labs such as Eurofins or Medallion, what analyses would yield the most appropriate results to compare with our NDSR calculated values?
Want to make sure you get notifications about new posts in the forum? Follow these steps:
- On your Personal LinkedIn Page, click “Notifications” on the top menu bar.
- Select “View Settings” under Manage Your Notifications.
- Under Notifications you receive, click “Groups”.
- Select “Groups Updates”.
- Set Email sent on your primary email to ON.

Did You Know? Featuring: NDSR View and Paste Ingredients Function
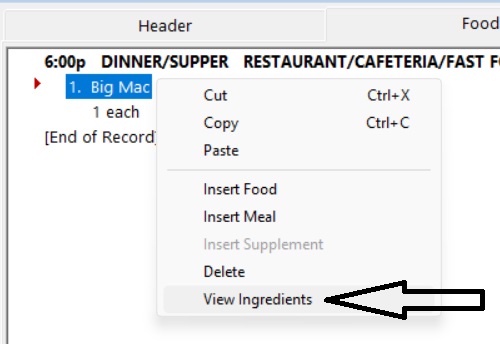
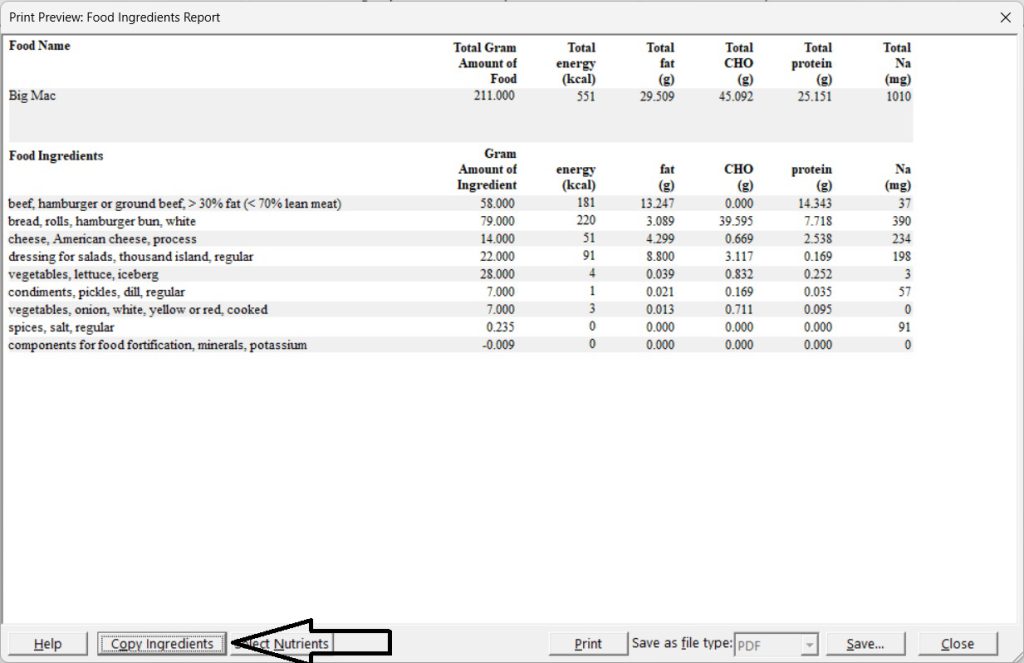
Many of our users are familiar with the View Ingredients function that allows you to view gram amounts and up to five nutrients for each ingredient in many multi-ingredient foods in the database. What you may not know is that you can copy the ingredients list and paste the ingredients with amounts into an assembled food, and then edit ingredients and/or amounts to better match the food reported by a participant. For example, if a participant had a Big Mac but scraped off the sauce and the cheese, you could use the Paste Ingredients function to paste the ingredients of the Big Mac into an Assembled Food, and then delete the sauce and the cheese.
Please note that the Paste Ingredients function should be used with discretion, in a way that best aligns with your particular study. Removing high fat/energy ingredients such as sauce and cheese from a Big Mac may be important. Removing a tiny amount of onions from the Big Mac may or may not be important. Consider your research questions and the time burden before using this feature liberally.
Want more information about how to use the View and Paste Ingredient functions? See User Manual Chapter 4 and three short tutorial videos on line.
NCC Associate Director Dr. Abby Johnson at Nutrition 2024
NCC Associate Director Dr. Abby Johnson will be at the American Society for Nutrition’s annual Nutrition 2024 conference in Chicago, IL. If you are planning to attend, consider going to her presentation “Development of a Method to Identify the MyPlate Food Groups for Plant-Based Alternative Products” on Sunday, June 30th during the 2:30pm session in the Nutrition Translation and Food Science Oral Session 15.
NCC Presentations from the National Nutrient Databank Conference
NCC Director Dr. Lisa Harnack and Database Scientist Jenny Stevenson enjoyed seeing many NDSR Users at the National Nutrient Databank Conference last month in Ottawa, Canada. Summaries of the two oral presentations delivered by Dr. Lisa Harnack—”Plant-based Milk Alternative Products are Highly Heterogeneous in Nutrient Composition” and “Snack and Meal Replacement Bars Available in the U.S. Marketplace are Heterogeneous in Macronutrient Content” are shown below.
Plant-Based Milk Alternative Products are Highly Heterogeneous in Nutrient Composition
Abigail Johnson, PhD, RD, Jennifer Stevenson, Janet Pettit, Bhaskarani Jasthi, PhD, RD, LD, Lisa Harnack, DrPH, RD. University of Minnesota Nutrition Coordinating Center
Background: The variability of nutrients in plant-based milk alternative (PBMA) products is not well documented, leaving gaps in understanding how to assess nutrient intake from PBMA in nutrition research and surveillance.
Methods: In 2022 University of Minnesota Nutrition Coordinating Center (NCC) database scientists identified leading brands of PBMA products available in the U.S. market. A formulation was created for each product from which composition values for the 175 nutrient, nutrient ratios and other food components were calculated. An internally developed program was used to create the formulations, with product ingredient and nutrition facts panel information key to deriving formulations. We compared nutrient variability within and across plant-base types for calcium, vitamin D, and vitamin A as % Daily Values (%DV) per serving. We limited our analysis to products (total n=196) made with almond (n = 61), cashew (n = 3), coconut (n = 21), hemp (n = 10), oat (n = 51), pea (n = 9), rice (n = 10), or soy (n = 31).
Results: We identified high nutrient variability between and within categories of PBMAs. Nutrient ranges were wide. For calcium, oat milks had the widest range (0 to 45%DV). For vitamin D, soy milks had the widest range (0 to 30%DV). For vitamin A, both almond and soy milks ranged from 0 to 40%DV. Nutrients were not normally distributed within each plant base category, instead bimodal and trimodal distributions were observed.
Significance: The source of nutrient variability between and within PBMA categories may be due to differences in fortification, with distribution modes occurring at common nutrient reporting thresholds (e.g., 10% and 20% DV). For researchers aiming to collect dietary intake information from populations consuming PBMA, this high variability underscores the need to record specific brand and plant-base information.
Snack and Meal Replacement Bars Available in the U.S. Marketplace are Heterogeneous in Macronutrient
Lisa Harnack, DrPH, RD, Abigail Johnson, PhD, RD, Janet Pettit, Jennifer Stevenson, Kristine Schmitz, Bhaskarani Jasthi, PhD, RD, LD. University of Minnesota Nutrition Coordinating Center
Objective: Evaluate the macronutrient content variability of snack and meal replacement bars for the purpose of determining whether a representative macronutrient profile across this product category may be acceptable in developing food frequency questionnaires (FFQs) and their accompanying food and nutrient databases.
Materials and Methods: The 2022 version of the University of Minnesota Nutrition Coordinating Center Food and Nutrient Database was used to describe the macronutrient content of 588 snack and meal replacement bars sold by 33 leading brands in the U.S. The median, minimum, maximum, and interquartile range (IQR) values per bar were calculated across all products and by product type.
Results: Energy and macronutrient content varied widely across all products. For example, the added sugar content per bar ranged from 0-31 g with a median value of 6 g and IQR of 8 g. Macronutrient content differed between products described as ‘protein/meat’ or ‘meal replacement’ in comparison to those described as ‘child’/kid’ (n=45) or lacking a specific descriptor. For example, the median protein content per bar was 13 g for protein/meat and meal replacement bars versus 2 g and 4 g for child/kid bars and those lacking a specific descriptor. Macronutrient content varied substantially within these product categories as well. For example, protein/meat bars had variable protein (median 13 g; IQR 10 g), saturated fat (median 3 g DV; IQR 3 g) and added sugar (median 4 g; IQR 7) content.
Significance: When developing a FFQ and accompanying food and nutrient database for use with a population where snack or meal replacement bar consumption is common, consideration should be given to asking for the specific brand of snack or meal replacement bar typically eaten. Alternatively, the type of bar (protein, meal replacement, or other type) could be queried with representative nutrient values included in the FFQ database.